
CLASSIFICATION
Numbered phrenological head
Phrenology wrongly claimed that the shape of a person’s skull revealed their character. We use this image to question how systems classify people, and when those claims should be challenged.
We chose these images to look at AI through its histories and the systems it depends on. Each one opens up a question, from how people are classified to the resources technology needs.
Phrenology wrongly claimed that the shape of a person’s skull revealed their character. We use this image to question how systems classify people, and when those claims should be challenged.

An old map of communication cables. It shows how much infrastructure sits behind something as simple as sending a message.

This diagram sorts human knowledge into categories. It makes us ask who decides how the world should be organised in the first place.

We chose this because SCAI is also about making time to read with other people.

Long before AI, people built machines to process information about other people. The work and decisions behind these systems are worth looking at.

AI depends on energy and physical infrastructure. This drawing brings the buildings behind the technology into view.

An old design organised around watching people. It raises questions about who can observe others and what that power means.

Gutta-percha was used to insulate submarine telegraph cables. Crawford and Joler trace this material history in Anatomy of an AI System. The plate invites us to ask which landscapes and resources make today’s networks possible.
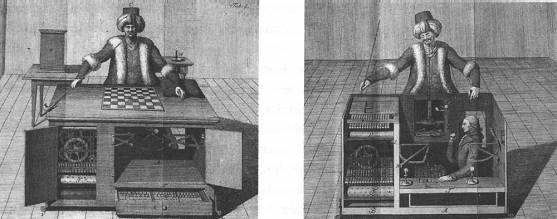
The chess-playing machine concealed a human operator. In Anatomy of an AI System, Crawford and Joler connect this spectacle to labour hidden behind digital interfaces. We use it to ask who labels, checks and maintains the systems we call automated.
Explore a few places connected to the systems behind AI. Choose a topic, then a location to read the evidence.
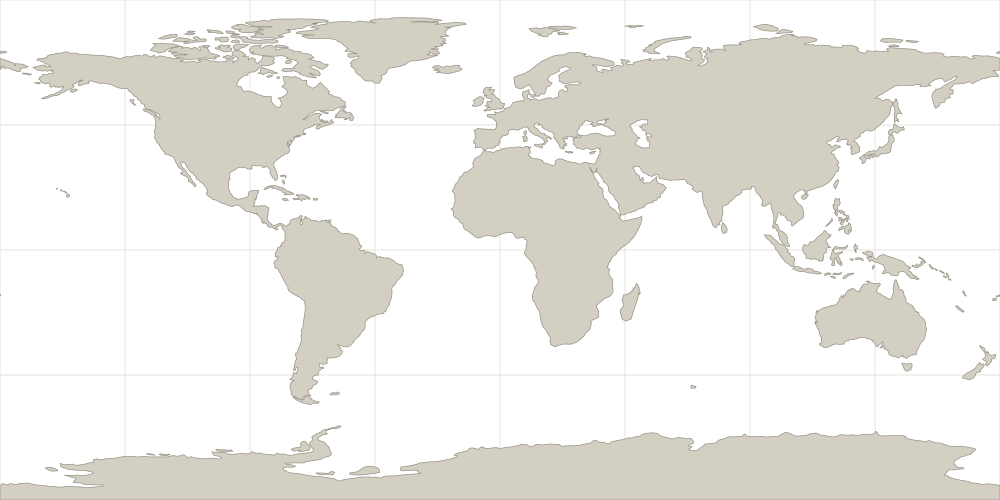
On a small screen, swipe the map or use the location buttons below.
Selected examples, not a complete supply-chain map. No trade routes or supplier relationships are implied. Markers use approximate coordinates.
Each note links to its source and states its geographic scope. Location profiles describe sites; research findings describe countries or regions. Equal-sized markers do not represent quantities.
The electricity layer uses the IEA’s published 2024 estimates. It is not a live dataset. These figures include non-AI workloads.
Basemap: Natural Earth, 1:110m land, public domain. Positions use longitude and latitude on the same equirectangular projection as the basemap. Country and regional markers are representative positions.
SCAI grew from Artificial Intelligence and/for the Social Sciences, a University of Zurich seminar in spring 2026. Its themes helped shape this image selection.
The seminar included Anatomy of an AI System by Kate Crawford and Vladan Joler. Their work influenced our choice of images and how we make the less visible parts of technology easier to see.
See the projectEach image links to its archive record and rights information.